
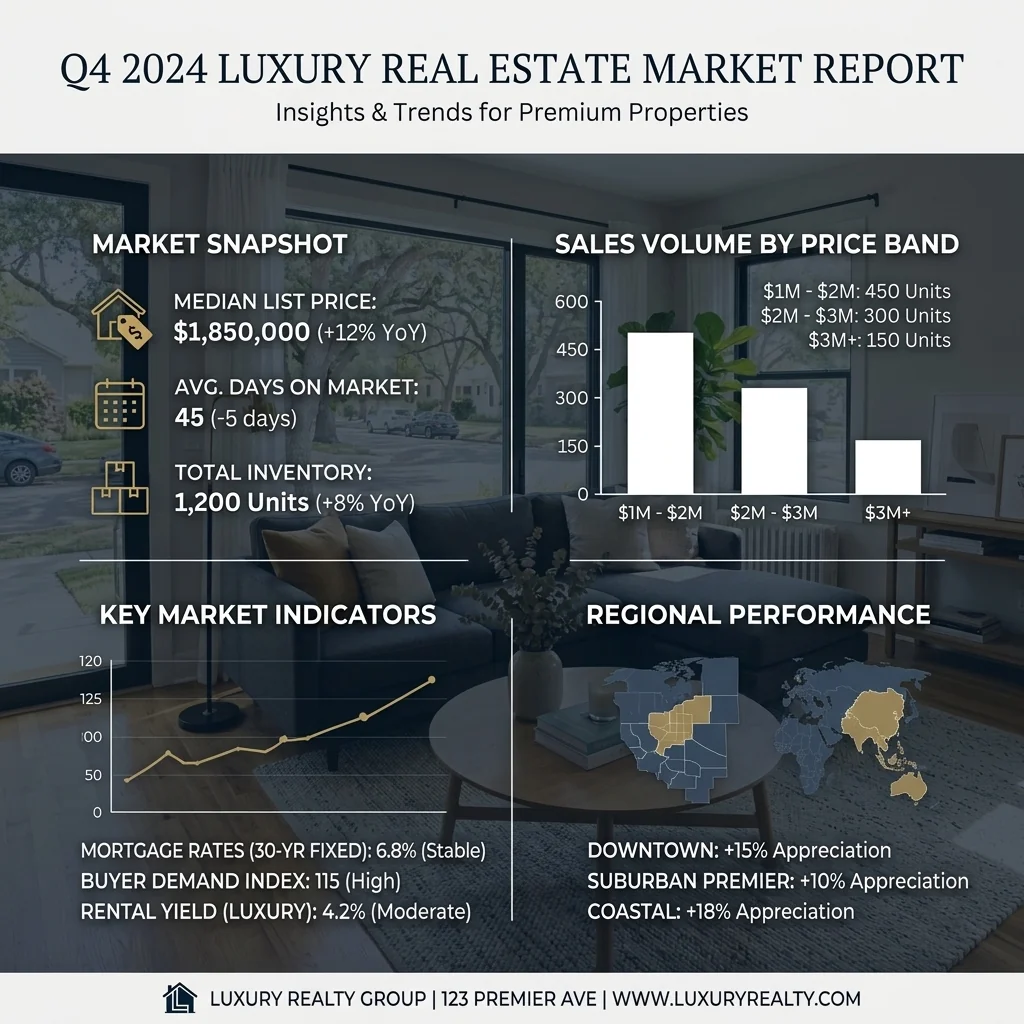
地域市場レポートのインフォグラフィック
- 写真
- 選択内容
- 画像
できることを見る
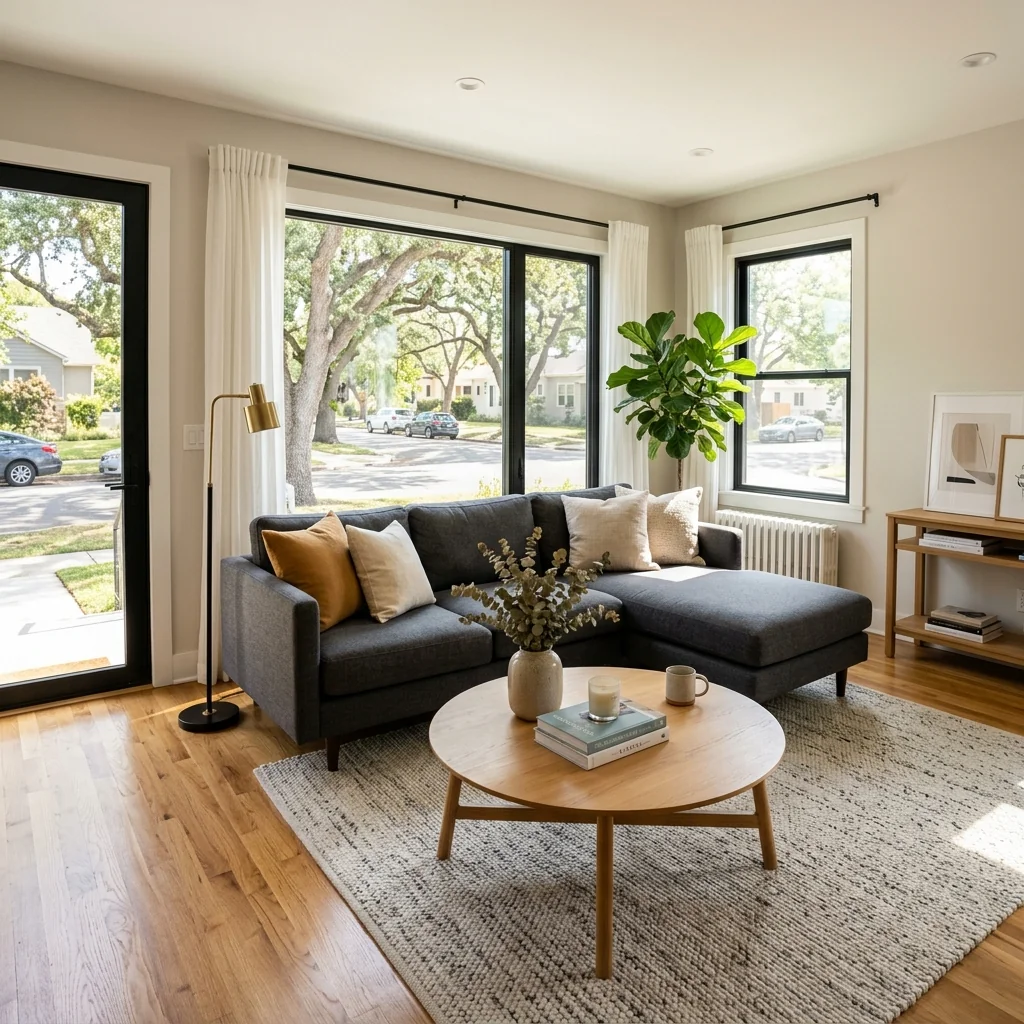
あなたのような写真から得られた実際の結果です。




使い方
- 1写真をアップロードしてください
- 2設定を選択してください
- 3画像
より良い結果のためのヒント
明るく、はっきりした写真
自然光と広角が最適な結果につながります。
全体が見えるようにしてください
変更したいものをすべて、しっかり画面内に入れてください。
いくつかのバリエーションを試す
決める前に、さまざまなオプションを比較できます。
よくある質問
画像を商用利用できますか?
はい。商用利用を含め、あらゆる目的で画像を使用できます。
元の写真は変わりますか?
いいえ。元の画像は変更されず、いつでもダウンロードできます。
結果が気に入らない場合は?
別のスタイルや設定を試すか、短い指示で結果を調整してください。
さらに見る
すべてのツール
エージェントの「チーム紹介」グラフィック
きちんと自己紹介しましょう。顔写真をアップロードすると、専門分野、対応エリア、連絡先情報を含む、見栄えのよい「エージェントについて」または「チーム紹介」のSNS用グラフィックを作成できます。

AI インテリアスタイル検出 & ムードボード
どんな部屋の写真でも、AIがインテリアデザインのスタイル、配色、主要素材を判定し、それに合うムードボードを生成します。既存空間の理解や、スタイルの好みを伝えるのに最適です。
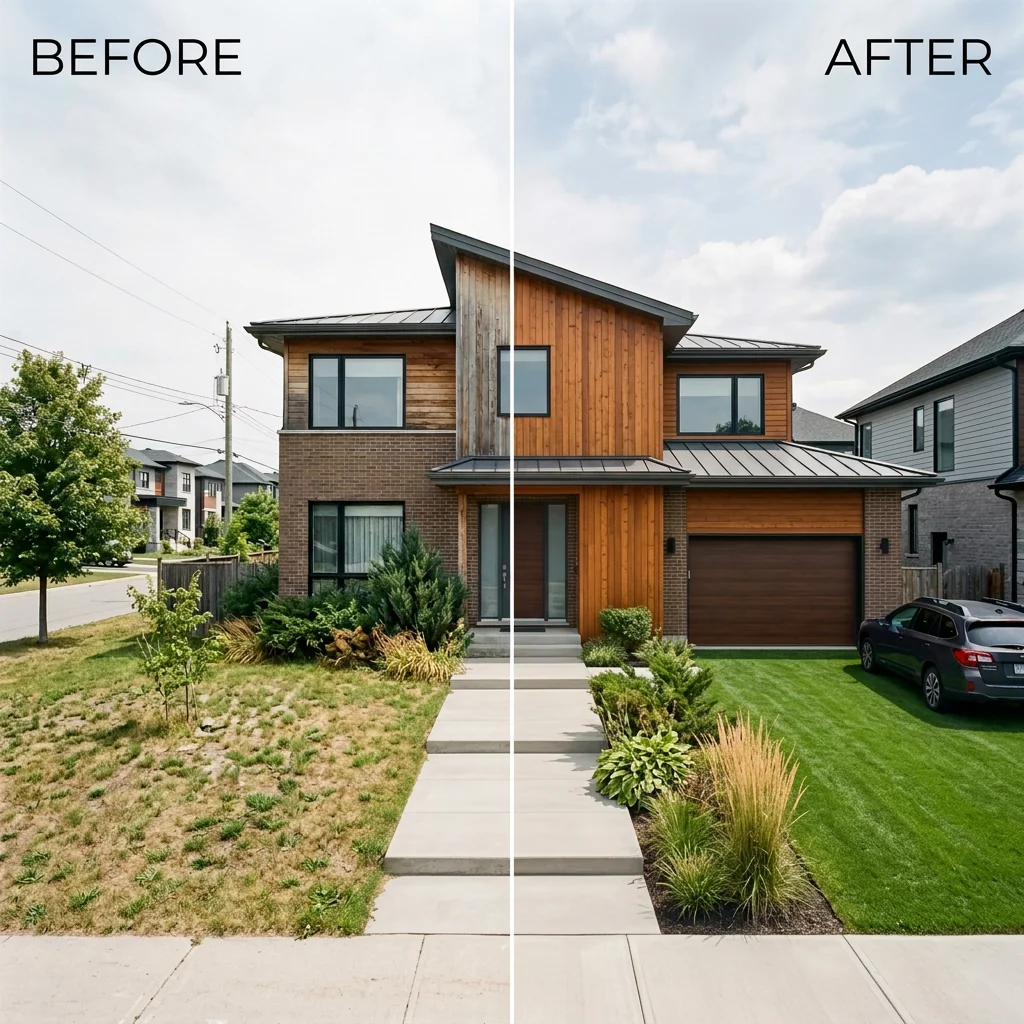
ビフォー&アフターの並列表示リスティング
不動産掲載用の、プロ仕様のビフォー・アフター比較画像を作成します。2枚の写真をアップロードすると、ラベル付きの洗練された横並び比較画像が生成され、MLS、SNS、販促資料に最適です。
完全ガイドを読む
How long does generation take for Local Market Report Infographic?
Generation usually takes between 5 and 15 seconds.
Can I use the results commercially?
Yes, every generated image includes a full commercial usage license.
Tips for your photo
Make sure the photo is well lit and shot from a wide angle.
Remove clutter before shooting the photo for the best results.
Use re-staging mode for targeted style changes.
Frequently asked questions
What are the optimal input formats and resolutions for my Local Market Report Infographic?
To transform your Local Market Report Infographic, upload high-resolution real estate photos (JPG, PNG, 1920px width minimum). For MLS data, ensure CSV or direct API integration for seamless data parsing, critical for any property listing.
How long does it take to generate a Local Market Report Infographic?
Convert your MLS data into a Local Market Report Infographic typically within 30-60 seconds. Processing time may vary slightly based on data complexity and image resolution, ensuring rapid delivery for any agent or property listing.
What is the output quality and resolution of the generated Local Market Report Infographic?
Enhance your property listing presentations with our Local Market Report Infographic output. Generated infographics are high-resolution (1080p for social, 300 DPI for print), optimized for crisp display on Zillow, Instagram, or printed newsletters.
What are the best tips for achieving optimal Local Market Report Infographic results?
Stage your Local Market Report Infographic for success by using clear, well-lit real estate photos. Ensure your MLS data is accurate and complete. Experiment with different templates to perfectly match your property listing branding and agent needs.
Can I regenerate or edit my Local Market Report Infographic after creation?
Yes, easily re-generate your Local Market Report Infographic. Simply adjust your MLS data or swap real estate photos and click re-generate. This allows for quick updates to reflect new market trends for any agent or property listing.
Technical FAQ: Local Market Report Infographic
Quick answers for optimal results
Common mistakes
5 Fatal Local Market Report Infographic Mistakes Killing Your Leads
How to generate a local market report infographic online that converts
Using Outdated MLS Data in Your Local Market Report Infographic
Presenting inaccurate data damages your credibility as a real estate agent. Zillow and other platforms update frequently.
Always pull data directly from the MLS or a trusted, up-to-date source before creating your Local Market Report Infographic. PropStage.ai's Local Market Report Infographic tool automatically updates with current data.
Failing to Brand Your Local Market Report Infographic
A generic infographic doesn't build brand recognition. Your property listing and real estate photos should be instantly recognizable.
Upload your logo, use your brand colors, and include your contact information on every Local Market Report Infographic generated with PropStage.ai. Ensure your agent photo is visible.
Overcrowding Your Local Market Report Infographic with Too Much Information
Too much data overwhelms viewers and makes the infographic difficult to understand. Keep it concise and focused.
Prioritize key data points and use clear, simple visuals in your Local Market Report Infographic. PropStage.ai's tool offers pre-designed templates that balance information and aesthetics.
Using Low-Quality Images in Your Local Market Report Infographic
Blurry or unprofessional images detract from the overall quality and impact of your market report. Especially the neighborhood photo.
Upload high-resolution neighborhood photos and property listing images to your Local Market Report Infographic. PropStage.ai optimizes images for best results.
Not Sharing Your Local Market Report Infographic Effectively
Creating a great infographic is useless if no one sees it. Maximize your reach by sharing strategically.
Share your Local Market Report Infographic on social media (Instagram, Facebook), email newsletters, and your website. Use PropStage.ai's download options to optimize for each platform.
What Your Local Market Report Infographic Results Will Look Like
Upload your photo to get started & see the AI magic!
Your workflow
Transform MLS Data: 5 Tips for a Stunning Local Market Report Infographic
How to create a local market report infographic online that attracts real estate clients
Upload
Upload a high-quality neighborhood photo to the Local Market Report Infographic tool. Ensure the photo is clear and representative of the local area for maximum impact on your property listing.
Use a professional real estate photos for better engagement. Consider staging the photo to highlight key neighborhood features.
Convert
Convert raw MLS data into visually appealing charts and graphs using the Local Market Report Infographic tool. The AI automatically overlays key data points onto your chosen image, saving you time and effort.
Customize the color scheme to match your agent branding for a consistent and professional look across all your marketing materials.
Enhance
Enhance your Local Market Report Infographic with relevant statistics and trends. The tool automatically pulls key metrics like average sale price, days on market, and inventory levels to create a compelling narrative for potential buyers and sellers.
Focus on data points that highlight the unique selling points of the local market to attract the right audience.
Stage
Stage your Local Market Report Infographic for optimal sharing across various platforms. Adjust the layout and dimensions to fit Instagram, Facebook, email newsletters, or printed materials. The tool offers pre-set templates for each platform.
Add a clear call-to-action, such as 'Contact me for a free market analysis,' to drive leads and generate new business.
Use cases
Real Estate Listings for Local Market Report Infographic
Social Media Marketing & Instagram Inserate
Architektur- & Umbau-Präsentationen
Local Market Report Infographic — Technical Specifications
1. Upload your property photo.
2. Choose the interior style or room type you want.
3. Click Generate and get your result in seconds.
Expert guide
5 Pro Tips: Dominate Your Local Market with Stunning Report Infographics
How to Generate a High-Converting Local Market Report Infographic Online
Stage High-Quality Real Estate Photos for Maximum Impact
Transform your local market report infographic by uploading crisp, professional real estate photos. Ensure your property listing image is well-lit and showcases the neighborhood's best features. This enhances visual appeal and captures attention on Zillow and the MLS, boosting your agent brand.
Optimize Key Settings for Data Clarity and Visual Harmony
Enhance your Local Market Report Infographic by carefully adjusting settings. Choose a color palette that complements your real estate photos and ensures data points are easily readable. Fine-tune font sizes and chart styles for optimal visual communication, attracting more potential clients.
Convert MLS Data into Compelling Visual Narratives
To achieve the best results, focus on translating complex MLS data into easily digestible visuals. Highlight key trends, such as median home prices and days on market, using clear charts and graphs. This simplifies information for potential buyers and sellers, establishing you as a knowledgeable agent.
Leverage Your Local Market Report Infographic for Professional Branding
Upload your logo and contact information to create a professionally branded Local Market Report Infographic. Share it across your social media channels, email newsletters, and printed marketing materials. This strengthens your brand identity and positions you as the go-to real estate expert in your local market.
How it works
3 Simple Steps to Create a Local Market Report Infographic
How to generate a local market report infographic for Instagram and MLS listings in 2025
Upload Your Neighborhood Property Photo
Upload a high-resolution real estate photo of a local property or neighborhood landmark to serve as the professional backdrop for your customized housing market data overlay.
Input Your Local MLS Data
Transform raw MLS statistics into visual trends by selecting your preferred design style and entering key neighborhood metrics like median home price, inventory levels, and days on market.
Download Your High-Res Infographic
Convert your data into a high-resolution file ready for Zillow, social media, or print newsletters, ensuring every agent looks like a data-driven expert to potential home sellers.
What you can do
Advanced Local Market Report Infographic Capabilities
Stunning Visual Local Market Report Infographic
Enhance property listings with high-resolution, print-ready Local Market Report Infographics. Transform raw MLS data into captivating real estate photos for your agent.
Instant Local Market Report Infographic Generation
Generate dynamic Local Market Report Infographics in seconds. Convert complex Zillow data and property listing information into actionable visuals, boosting agent efficiency significantly.
Multi-Platform Local Market Report Infographic Export
Export Local Market Report Infographics in JPG, PNG, and PDF. Upload real estate photos and share across social media or email, expanding your agent's reach.
Tailored Local Market Report Infographic Designs
Customize every element of your Local Market Report Infographic. Stage property listing data with personalized branding, colors, and fonts, reflecting your agent's style.
AI-Powered Local Market Report Infographic Accuracy
Leverage advanced AI for precise data interpretation in your Local Market Report Infographic. Enhance property listing insights from MLS data, ensuring accurate trends for agents.
Professional Local Market Report Infographic Marketing
Elevate marketing with professional Local Market Report Infographics. Convert real estate photos and Zillow data into compelling visuals for client presentations, attracting property listings.
Pro-level tools at your fingertips