
Local Market Report Infographic
Create a market-report graphic from a photo and the figures you supply. Review every number, chart and source; the tool does not fetch or verify live market data.
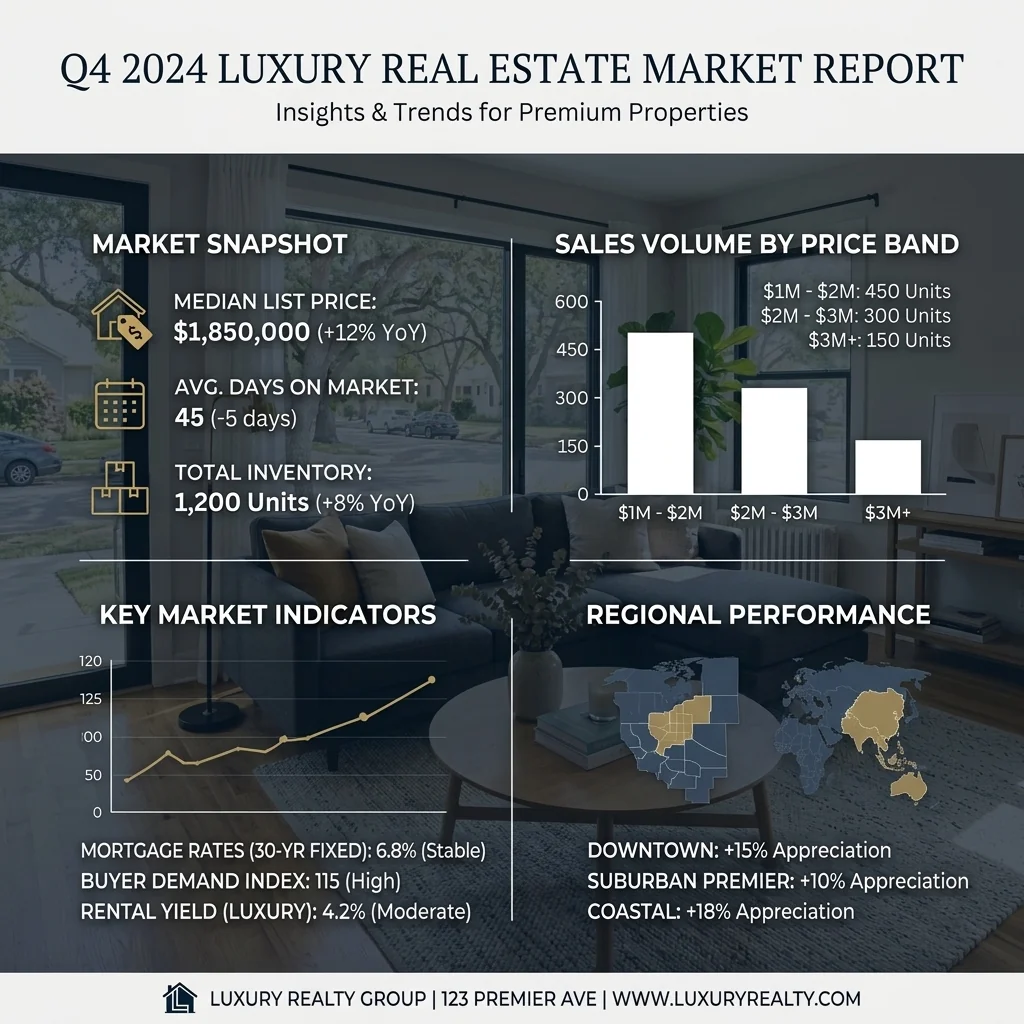

Example · Your result depends on your photo and settings.
1 image free after verified sign-in · No credit card
Choose a photo. Review the look. Sign in to create.
Examples and photo tips
What to prepare
JPG, PNG, WebP, HEIC or HEIF · up to 20 MB per photo
At least 64 × 64 pixels; JPG/PNG/WebP up to 40 megapixels.
HEIC/HEIF: up to 4 megapixels. Larger images need a JPG, PNG or WebP copy.
A clear source photo
Well lit, with the whole area visible.
An idea of the change you want
The editor shows the options for this tool.
Review AI changes before publishing a property image.
Explore more examples
View original photo
Before

View original photo

Before

View original photo

Before
About this tool
Marketing & Distribution Outputs
Prepare your idea
Create a market-report graphic from a photo and the figures you supply. Review every number, chart and source; the tool does not fetch or verify live market data.
Prepare your source photo and the references listed in the form. Its settings describe the intended changes.
Review the request and result
Review availability, image count and the current total before explicitly confirming. Registration alone does not establish credits or a free result. If the outcome is unclear, check the saved status of the existing request before confirming again.
Read the earlier original guide
This earlier guide may contain historical price, timing, quality or usage statements. Use the current description and tool form.
Local Market Report Infographic Examples: Before & After Results (2026)
See how agents use Local Market Report Infographic to transform listings & boost Zillow views
Expert guide
5 Tips: Dominate Your Market with a Local Market Report Infographic
How can Local Market Report Infographics enhance my property listing on Zillow?
Local Market Report Infographics transform static MLS data into visually appealing graphics, instantly grabbing attention on Zillow. By showcasing neighborhood trends and key data points, you provide valuable insights to potential buyers, making your property listing stand out. These infographics also highlight your expertise as a knowledgeable real estate agent.Are there any MLS regulations I need to consider when using Local Market Report Infographics?
Yes, it's crucial to ensure your Local Market Report Infographic complies with MLS guidelines and NAR advertising standards. Always verify data accuracy and disclose the source of your information (e.g., MLS). Avoid misleading representations and ensure your infographic accurately reflects the current market conditions. Seek legal counsel if uncertain about compliance.What is the cost of creating a professional Local Market Report Infographic?
The cost of creating a Local Market Report Infographic varies. Hiring a designer can be expensive. However, using PropStage.ai's tool allows you to generate high-quality infographics quickly and affordably. Our AI-powered tool automates the design process, saving you time and money while maintaining a professional look. Explore our pricing plans for options that fit your budget.How can I ensure the quality of my Local Market Report Infographic?
To ensure a high-quality Local Market Report Infographic, start with accurate MLS data. Use clear and concise language, and choose visually appealing charts and graphs. PropStage.ai’s tool automatically formats data into professional designs. Upload high-resolution real estate photos and review the final product for clarity and accuracy before sharing with clients.What are the best uses for a Local Market Report Infographic in my real estate business?
Local Market Report Infographics are incredibly versatile. Share them on social media (Instagram, Facebook), include them in email newsletters, print them for open houses, or use them in client presentations. They establish you as a local market expert, attract potential clients, and provide valuable insights that help buyers and sellers make informed decisions. Use them to showcase your property listing effectively.How can I integrate Local Market Report Infographics into my existing real estate workflow?
Seamlessly integrate Local Market Report Infographics into your workflow by using PropStage.ai's tool. Upload your data, customize the design, and download the infographic in various formats. Schedule social media posts, add the infographic to your email templates, and print copies for client meetings. This streamlines your marketing efforts and enhances your client communication strategy.Transform boring MLS data into gorgeous, shareable market report graphics. Upload a neighborhood photo and AI overlays beautiful charts, trends, and data points perfect for Instagram, emails, or printed newsletters.
How it works
How AI Local Market Report Infographic Works
Data to dazzling visuals in minutes.
Upload a Neighborhood Photo
Start with a captivating neighborhood image. Our AI uses this to create a branded, hyper-local real estate market report graphic.
Input Key MLS Data Points
Enter essential MLS data like average sale price and days on market. PropStage.ai instantly transforms it into engaging charts.
Download & Share Your Report
Get a stunning, branded real estate market report infographic ready for social media, email, or print. Impress your clients instantly!
What you can do
Stunning Market Report Infographics, Fast
AI-Powered Design
Instantly convert raw MLS data into visually appealing, branded market report infographics with no design skills needed.
Neighborhood Photo Integration
Upload a local photo, and our AI seamlessly overlays market data for a hyper-local, personalized touch.
Dynamic Data Updates
Ensure your infographics always showcase the latest market trends with automatically updated MLS data integration.
Multi-Platform Ready
Download your market reports in formats optimized for Instagram, email marketing, print, and more.
Customizable Branding
Easily add your logo, colors, and contact information to maintain consistent branding across all your reports.
Targeted Local Expertise
Showcase your in-depth knowledge of specific neighborhoods and attract more local clients with data-driven insights.
Transform MLS data into engaging visuals that win clients and build your brand.
Wow Clients with Market Report Infographics
Effortlessly transform MLS data into stunning visuals with AI. Perfect for social, email, and print.
Compare editing approaches
Review timing, cost, available options and the editing steps for your photo.
Creation time
Other services: Agree on a delivery deadline before work starts.
PropStage: Processing time varies. If a result is delayed, check its saved request status instead of sending the same request again.
Cost per image
Other services: Ask for a written quote covering the agreed work and any additional fees.
PropStage: Review the credit cost before confirming a request. Check the current offer before choosing a plan.
Styles and variations
Other services: Confirm which styles and revisions are included.
PropStage: Use the options offered by this tool. Review the credit cost before confirming each new image request.
Editing workflow
Other services: Agree on the source photos, references and final review.
PropStage: Review the required photos and settings before confirming. Keep your original and compare the saved result before publishing.